FLORIDA — With a strong El Niño in place, Florida is heading into a winter that could be much wetter than usual. As part of Florida El Niño Awareness Week, the state’s emergency managers and weather officials are highlighting free tools anyone can use to track how much rain is falling. Day 3 of the campaign focuses on flooding impacts during El Niño, a timely topic after record rain hit the Space Coast earlier this month.
Why El Niño Matters for Florida Winters
El Niño is a warming of the Pacific Ocean near the equator that shifts weather patterns around the world. For Florida, it often means a more active storm track across the Gulf of Mexico during winter. That can bring more frequent rain, heavier downpours and a higher risk of flooding than a typical winter.
Normally, Florida’s winter months are among its driest. During El Niño, that pattern can flip.
Tool 1: Observed Rainfall Maps
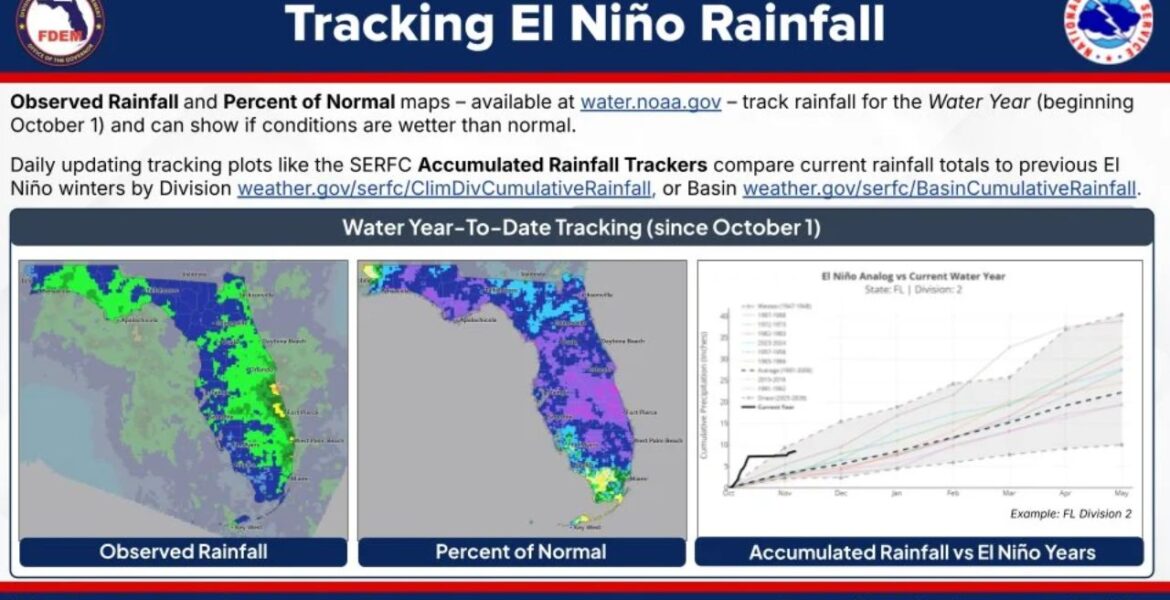
The first tool is the Observed Rainfall map, available at water.noaa.gov. It shows how much rain has fallen across the state since the start of the water year, which begins on October 1.
The current map shows heavier totals along much of the peninsula, with some of the brightest colors near the east-central coast. That lines up with the extreme rain that recently hit Brevard County, where areas near Palm Bay saw up to 26 inches in just 48 hours.
Tool 2: Percent of Normal Maps
The second tool shows Percent of Normal rainfall, also at water.noaa.gov. Instead of raw totals, it compares how much rain has fallen to what usually falls by this point in the season.
This is helpful because 10 inches of rain means something very different in different parts of the state. The current map shows much of Florida in deep purple shades, pointing to rainfall running above normal in many areas since October 1.
Tool 3: Accumulated Rainfall Trackers
The third tool is a set of Accumulated Rainfall Trackers, which update daily. These charts compare this year’s running rainfall total with past El Niño winters and the long-term average. Residents can look at trackers by climate division at weather.gov/serfc/ClimDivCumulativeRainfall or by river basin at weather.gov/serfc/BasinCumulativeRainfall.
In one example for a Florida climate division, this year’s rainfall line climbs sharply in October and early November, already running well above the long-term average. That steep early climb is the kind of signal forecasters watch closely during El Niño winters.
What Each Tool Tells You
| Tool | What It Shows | Where to Find It |
|---|---|---|
| Observed Rainfall | Total rain since October 1 | water.noaa.gov |
| Percent of Normal | How wet it is compared to usual | water.noaa.gov |
| Accumulated Rainfall Trackers | This year versus past El Niño winters | weather.gov/serfc |
Why Tracking Rain Helps Prevent Flood Damage
When the ground is already soaked, even a moderate storm can cause flooding. Canals, lakes and retention ponds also fill up over time, leaving less room for new rain. Knowing how wet your area already is can help you prepare before the next storm arrives.
Farmers, homeowners, local officials and emergency planners all use these tools to spot rising flood risks early in the season.
How to Prepare for a Wet El Niño Winter
- Check rainfall maps for your area every week or two this winter.
- Clear gutters, drains and ditches around your home before heavy rain.
- Know your flood zone and whether your home is in a low-lying area.
- Review your flood insurance, since standard home policies usually do not cover flood damage.
- Never drive through flooded roads, even if the water looks shallow.
- Keep emergency supplies ready, including water, food, medicine and flashlights.
Boxingessential.com will continue tracking El Niño rainfall and flooding risks across Florida, including the Space Coast and communities statewide, and will provide updates as rain totals, flood threats and winter storm patterns develop.
You may also like
Leave a Reply